Comments Guidelines

All comments are pre-moderated. No spam, slurs, personal attacks, or foul language will be allowed.

Friday, December 28, 2012

Surprise! Facebook Avoids its European Taxes

If you are as cynical as I am, I know you are not surprised that Facebook paid Irish taxes (via Tax Justice Network) of about $4.64 million on its entire non-US profits of $1.344 billion for 2011.* This 0.3% tax rate is a bit below the normal, already low, Irish corporate income tax of 12.5%.

As with Apple, Facebook funnels its foreign profits into its Irish subsidiary. As the Guardian article explains:
Facebook is structured so that companies buying advertisements on the website in the UK, or anywhere outside of the US, have to pay Facebook Ireland.
As a result, Facebook manages to slash its taxes in other countries, paying, for example,  $380,800 in British tax on estimated 2011 UK profits of $280 million, or a little over 0.1%. What is shocking is that Facebook paid so much Irish tax since it managed to convert its $1.3 billion gross profit into a net loss of $24 million.

As you've no doubt figured out, it's that "Double Irish" ploy again. Facebook operates a second subsidiary that is incorporated in Ireland but controlled in the Cayman Islands. This subsidiary owns Facebook Ireland, but the setup allows the two companies to be considered as one for U.S. tax purposes, but separate for Irish tax purposes. The Caymans-operated subsidiary owns the rights to use Facebook's intellectual property outside the U.S., for which Facebook Ireland pays hefty royalties to use. This lets Facebook Ireland transfer the profits from low-tax Ireland to no-tax Cayman Islands. For more on the arcane mechanics, see Joseph Darby's article "International Tax Planning," downloadable at Wikipedia.

This makes no sense of course, but is, in David Cay Johnston's inimitable phrase, Perfectly Legal. But it shouldn't be. And in the UK, Chancellor of the Exchequer George Osborne has announced 
a £154m [$246.4 million] blitz on tax avoidance and evasion, with HMRC [the British equivalent of the IRS] hiring an extra 2,500 tax inspectors to target high earners who aggressively exploit loopholes to avoid or evade tax.
The U.S. should do the same.

* Dollar figures converted from pound sterling figures in the Guardian at an exchange rate of $1.60 per pound.

Friday, December 21, 2012

Conservative ALEC Economic Policies Have No Benefit, Some Risks, for States

The economic policies proposed for states by the conservative American Legislative Council Exchange (ALEC) not only don't work, but carry risks for states' economies, according to new research by the Iowa Policy Project and Good Jobs First.

As we have seen most recently with Michigan's passage of anti-union so-called "right to work" legislation (which lets people free ride on union contracts and makes union organization and representation more difficult), the legislative agenda of ALEC proclaims that states should follow a low-tax, low-wage, non-union route to economic prosperity. Now, you or I might wonder how creating low-wage jobs is supposed to create prosperity, but luckily for us ALEC has ranked the states by how "competitive" their economic policies were beginning in 2007, giving us the chance to see how well their recommended policies have done.

ALEC's 15 recommended factors (p. 18) include taxes, debt service, public employees per 10,000 residents, "quality" of the legal system, "right to work," minimum wage, and workers' compensation costs. As pointed out by earlier commentaries, it says nothing about education or infrastructure, which have clear effects on a state's economy. The new report by economist Peter Fisher with Greg LeRoy and Phil Mattera undertakes a statistical analysis of these policies, using the ALEC ranking of all 50 states as of 2007 to see how well their economies have performed since then. Fisher et al. also highlight the shoddy statistical work by Arthur Laffer in creating the ALEC index and reporting results.

Whereas Laffer frequently makes his points simply by comparing the top vs. bottom 8-10 states, Fisher et al. start with a full comparison of all 50 states via a correlation analysis, then proceed to the necessary addition of holding other potential causes constant in what is know as multiple regression analysis. Beginning with the correlations, here is what the new report finds. Correlation runs from -1 (perfect negative relationship) to +1 (perfect positive relationship); the closer to +1 below, the better the ALEC competitiveness index predicted the following outcomes. All changes are from 2007 to 2011.

ALEC Competitiveness Index ranking correlated with--

State gross domestic product:  .02 (not statistically significant)
Percent change in nonfarm employment: -.09 (not statistically significant)
Percent change in per capita income: -.27 (statistically significant)
Percent change in state and local government revenue: -.16 (not statistically significant)
Percent change in median family income: -.30 (statistically significant)
Change in poverty rate: .21 ("statistically significant" at the .1 level*)

What this tells us is that the states which were following ALEC's preferred policies the most in 2007 saw worse performance in per capita income growth and median family income as well as a worse performance n poverty that we can almost be sure was not due to chance. The only thing ALEC's top states did see as predicted was an increase was in  population (Fisher et al. did not report the correlation coefficient, but their discussion makes it clear that it was statistically significant). However, population growth per se is not an economic outcome, as the report points out.

The concluding regression analysis weakens the case for negative consequences, but provides no support for positive effects of ALEC's state policies. Fisher et al. show that the most important determinants of 2007-11 GDP growth, employment growth, and per capita income growth are the components of a state's economy, with the strongest determinants being the presence of extractive industry (primarily due to the higher price of oil during this period) and a large health care industry. Once these are controlled for, none of the ALEC variables are statistically significant, though the closest is that the top personal income tax rate is associated with higher, not lower, per capita income growth.

If none of ALEC's policies work as advertised for job and income growth, what do they do? They are, in fact, a prescription for economic inequality. So-called "right to work" does not increase growth, but it reduces workers' bargaining power. Reducing taxes on the wealthy increases post-tax inequality. And so on, down the panoply of ALEC policies. Fisher et al. (p. 11) put it well:
The ALEC-Laffer strategies are exclusively those that would lower taxes on corporations and the wealthy, reduce public sector revenues (and hence public investments in education, health and infrastructure), and lower wages by eliminating minimum wages and weakening the bargaining power of workers. Yet the book claims that all of these measures would make states, and their populations, richer.

The report is Selling Snake Oil to the States, and that is precisely what ALEC's policies are.


* Technical note: I'm old school on when we should consider something probably not due to chance. For generations, the standard cutoff was that you have to be 95% certain a result was *not* due to chance to call it statistically significant. In economics, and now increasingly in political science, researchers have sometimes called a result statistically significant using a 90% cutoff instead. In my view, this shift has been due to what is called "publication bias": it is easier to get your study published in an academic journal if you have some statistically significant result. But this is a big problem in areas like minimum wage research, where not finding a statistically significant negative effect from increasing the minimum wage actually tells you a great deal. The key analysis of publication bias in minimum wage research can be found in David Card and Alan Krueger's book Myth and Measurement.

Cross-posted at Angry Bear.

Thursday, December 13, 2012

Suppression of Congressional Research Service Report Reversed

Just as quietly as it happened, the Republican suppression of a Congressional Research Service (CRS) report showing the lack of relationship between top tax rates and economic growth has apparently been overcome. Jared Bernstein reports today that the report is back up. You can find it on the CRS website here.

What made this report so objectionable to Republicans was that it showed no relationship between the top tax rates and economic growth rates, and went beyond simple correlation analysis to more complex analysis that statistically controlled for other potential causes, known as regression.

Moreover, it performed the same series of analyses on the data for tax rates and inequality, showing that a low top tax rate contributes to economic inequality, again controlling for other potential causes.

It is good to see that the non-partisan CRS is still allowed to post the results of its own research. But it's bad that there could ever have been any question of it.

Sunday, December 9, 2012

Appearing on National Progressive Talk Radio Tonight

Sorry for the short notice, but I will be on Lane Prophet's live call-in show on National Progressive Talk Radio at 9pm Eastern/6pm Pacific for one hour. I'll be talking about the so-called "fiscal cliff" and, probably subsidies as well. Here is the announcement from NPTR: http://www.blogtalkradio.com/national-progressive-talk-radio/2012/12/10/the-fiscal-cliff--kenneth-thomas--nptr-29

If you want to call in, the number is 347-326-9690.

NYT Series Illuminates -- And Confuses -- The State of the Subsidy Wars

Louise Story's series in the New York Times this week has created a substantial buzz about the issue of economic development subsidies.This is a welcome development, because it's an issue that doesn't get nearly enough attention in the highest profile media. Story has, in addition, appeared on shows such as MSNBC's "Morning Joe" and NPR's "Fresh Air," bringing subsidies to an even wider audience.

She crafted a number of stories that highlighted the big picture issues: imbalance in bargaining power between city governments and giant multinational corporations, the blatant conflicts of interest on display in Texas subsidy procurement, and a border war between Kansas and Missouri involving multimillion dollar incentives to move existing facilities across the state line, with no net benefit for the Kansas City metropolitan area, let alone for the U.S. as a whole.

The last few days have given me time to absorb the articles and the database Story created, as well as surveying the commentary on the web from well-known experts on subsidies. Several tentative conclusions seem in order.

First, as I pointed out in my last post, and backed up by Timothy Bartik's detailed analysis of Michigan, 5/8 of the national total is in the form of sales tax breaks, and probably the overwhelming majority of those sales tax reductions should not be considered subsidies. Here is what Bartik says about Michigan:
For example, in my own state of Michigan, the New York Times database identifies $6.65 billion in annual state and local business incentives. Of this total, $4.83 billion is in “sales tax refund, exemptions, or other sales tax discounts”.  Of this $4.83 billion, almost all of these refunds come from two provisions of Michigan tax law. First, Michigan does not apply the sales tax to most services, including business services, which saves businesses $3.88 billion annually. Second, for manufacturing, Michigan does not apply the sales tax to goods used as inputs to the manufacturing process, which saves manufacturers about $0.92 billion in sales tax.
For those keeping score at home, that means that $4.80 billion of the $4.83 billion in sales tax breaks should not be considered subsidies, unless you consider manufacturing "specific" enough that this aid constitutes a subsidy, in which case only 80% of the sales tax breaks should be excluded from the subsidy tally.

Second, changes of this magnitude mean that the Times estimates are not sufficiently accurate to use in a statistical analysis, as Richard Florida attempts in The Atlantic Cities. Finding out if incentives affect outcomes like wages, employment, or poverty is precisely the type of analysis we would like to do, but the fragility of the data makes this premature. The good news is that since the data on these state programs are all in one place, it should be possible to get a better handle on state incentives by cutting out those programs which should not be considered subsidies. Different analysts will no doubt have different judgments about what should be counted as a subsidy, but since the database is so inclusive, it should be useful no matter what your definition of subsidy is.

Third, there are some smaller errors in the program database as well. The one I have identified so far is that it counts net operating loss (NOL) tax provisions as subsidies in Illinois and New Hampshire, but not in other states, even though all states with a corporate income tax will have an NOL provision. In any event, this should not be considered a subsidy at all, but a part of a state's basic macroeconomic framework. In addition, Timothy Bartik pointed out to me in correspondence that the program database does not include single sales factor apportionment (only counting what percentage of a multi-state firm's sales take place in a given state, rather than standard three-factor apportionment that uses percentages of payroll and property as well) as a subsidy, which it should.

Fourth, the program database does not distinguish between investment incentives (subsidies to affect the location of investment) and subsidies more generally, which may or may not require an investment to obtain them. This is an important distinction I have tried to make clear by providing separate estimates in Investment Incentives and the Global Competition for Capital: $46.8 billion in incentives, and $65 or $70 billion in subsidies, depending on whether or not you count non-specific accelerated depreciation as a subsidy.

Finally, as Phil Mattera at Good Jobs First points out, the deals database misses a number of large awards, leaving out Tennessee's $450 million (present value) subsidy to Volkswagen and an even bigger package for ThyssenKrupp in Alabama. It also underestimates other awards, including Apple in North Carolina and Boeing in South Carolina. I also found that it underestimated subsidies to Dell and Google in North Carolina by omitting the local subsidy portion of the awards, a problem Ms. Story is aware of, as I noted in my last post.

The Times series has been great for the spotlight it has put on state and local subsidies and the sometimes vulgar politics surrounding the process of awarding them, and for compiling a great database of programs all in one place. However, its interpretation of the sales tax breaks, which are 5/8 of the national total but largely not subsidies, confuses the issue of total impact on state and local budgets and makes statistical analysis premature. This will require some work to fix, but it appears like most of the raw material is there to do it.

Cross-posted at Angry Bear.

Sunday, December 2, 2012

NYT: $80 Billion in State and Local Subsidies Annually (Updated)

In today's New York Times, Louise Story begins a series, "The United States of Subsidies," ten months in the making, with a story focusing on General Motors closures, the border war for investments between Kansas and Missouri in the Kansas City metropolitan area, and a new estimate of state and local incentives to business, $80 billion a year. Backing this up, and no doubt contributing to the long lead time, is a database of 150,000 state and local subsidy deals going back at least 20 years. Given its appearance in the country's newspaper of record, the series is sure to elevate the issue of state and local subsidies to a prominence it has never known before.

Since my 2011 estimate was $70 billion per year in total subsidies to business, and $46.8 billion in location incentives, the Times figure represents a substantial increase if accurate. Ever since David Cay Johnston reviewed my book when it first came out, he has argued that my $70 billion figure was probably an underestimate, and the new report would seem to back him up. Nevertheless, I will certainly be spending some time analyzing the database to see just what is in it. According to the story, $18 billion per year is accounted for by corporate income tax breaks, a whopping $52 billion by "sales tax relief," and the other $10 billion unspecified but most likely property tax breaks. I have some questions about these numbers, however.

First, it seems to me that property tax breaks likely exceed $10 billion a year. When California axed tax increment financing earlier this year, it was generating $8 billion in tax increment all by itself. Although California cities were by far the biggest user of TIF, municipalities in almost every other state still use it, as well as myriads of property tax abatements offered at the local level. Story is well aware of this. She writes:
The cost of the awards is certainly far higher. A full accounting, The Times discovered, is not possible because the incentives are granted by thousands of government agencies and officials, and many do not know the value of all their awards.
Thousands of local governments give subsidies, and these are overwhelmingly related to property tax. In my most recent estimate, there were several states in Missouriwhich local subsidies exceeded state subsidies, including Missouri and Michigan, so my default  assumption was that they were equal if I did not have adequate information on local incentives, as is usually the case due to the huge number of governments involved.

On the other hand, there is some chance that the $52 billion in sales tax subsidies could be an overestimate; it all depends on what The Times includes in this category. My own thinking about sales tax has changed since I first created the subsidy estimates in my 2000 book, Competing for Capital. My estimate for Minnesota, for example, included many hundreds of millions per year in sales tax exemptions for business services. Now, I tend to think of these tax breaks as methods to avoid tax cascading (paying the sales tax on a good more than once, by taxing the full value of every intermediate good) and not a subsidy at all. They have been removed from my estimate of total subsidies in my more recent work, which did not prevent my estimate for 2005 (published in 2011) from being $20 billion higher than that for 1995 (published in 2000). I do still count some sales tax breaks as subsidies, particularly those on plant and equipment, which apply to the initial investment rather than ongoing operations.

While this may seem like a sterile academic argument, in fact it makes a big difference whether incentives are $50 billion a year or $80 billion a year, approximately 600,000 public sector jobs paying $50,000 annually. The larger the true figure, the more pressing is the case for subsidy reform. The inauguration of this new series of articles, plus the database, will help us put a better number on the value, a critical first step toward galvanizing public opinion to force politicians to rein in subsidies.

I will be commenting more on this series over the course of this week.

UPDATE: Text corrected to reflect that although I had specific data for local incentives in Michigan, the total of local incentives was somewhat lower than that of state incentives. In addition, it is clearly true that TIF in California exceeded state subsidies, so obviously so did the total of local subsidies. However, I did not know this at the time I made the estimate.

Cross-posted at Angry Bear.

Tuesday, November 27, 2012

Gigantic Journalistic Investigation Begins Ripping Mask off Bank Secrecy

While Mitt Romney may be fading from view in the wake of his defeat on November 6, the issue of tax havens is definitely not following suit.

Via the Tax Justice Network, I've just learned of a massive, multi-national joint investigation into secrecy jurisdictions by three very heavy hitters, the Guardian, BBC Panorama, and the U.S.-based International Consortium of Investigative Journalists (ICIJ). Though they are starting out with the United Kingdom and the seriously understudied situation in the British Virgin Islands, ICIJ has announced that this is just the start of a multi-year investigative project and that there are "many more countries to come in the next 12 months." Further, according to ICIJ, the investigation involves literally "dozens of jurisdictions and in collaboration with dozens of media partners and freelance journalists around the world" (emphasis in original).

As I write this, the first and second articles (Nov. 25 and 26) in the Guardian's series rank number two and number one in the "most viewed" articles in the last 24 hours. One of the most amazing articles discusses the use of "nominee" directors, people who pretend to be a company or foundation's directors in order to hide the true ownership from authorities. Incredibly, these nominee directors frequently do not know the companies they are supposedly responsible for; they just know that they are getting paid for the use of their names. Be sure to check out the BBC undercover film linked from this Guardian article.

The tremendous scope of the journalistic investigation begs the question: where is government on this? Part of the answer is that government is way behind the curve. In 1999, the British government claimed to have stamped out a nominee sham colorfully named the "Sark Lark," for the tiny Channel Island of Sark where the nominees lived. However, it turns out that the perpetrators of the Sark Lark have simply moved all over the world to continue their scam; the BBC caught up with one former Sark resident in Mauritius.

The other part of the answer is that much of these activities are, in the immortal title of David Cay Johnston's book, "perfectly legal." It appears that in many cases governments do not make the effort to sift the illegal from the legal activities.

But let's not forget: tax havens cost the middle class worldwide hundreds of billions of dollars in tax revenue that they have to make up. The evidence is mounting that they are a central piece of the world financial system. Fundamental reform is necessary and a massive journalistic effort like this one will help produce the outrage to make it possible. I'm looking forward to more fruits of this investigation.

Cross-posted at Angry Bear.

Thursday, November 15, 2012

What the Fiscal Cliff Means for the Middle Class

Now that the election is over, it seems like all the politicians and pundits can talk about is the so-called "fiscal cliff." But the chatter around the fiscal cliff is deeply weird, so in this post I will explain what it is and what the issues involved mean for the middle class.

Just what is the fiscal cliff? It is the combination of spending cuts and tax increases set to take place on January 1 based on several different laws. Estimates of the consequences run as high as $800 billion next year, or 5.2% of the country's $15.29 trillion gross domestic product in 2011. Yes, that would mean a recession, with obvious consequences for the middle class. But this is only true if we did nothing after January 1, and that's not going to happen.

To put it another way, $800 billion is a 72.7% cut in the government's budget deficit for the just ended 2012 fiscal year. You would think this would make the people calling for an immediate cut in the deficit happy, but nooooo. Just the opposite, which is the weirdest aspect of the entire debate. I'll come back to that in a minute; first, let's look at the main components of the fiscal cliff.

The biggest chunk is $426 billion from the final expiration of the Bush tax cuts, according to a Bloomberg analysis in July. Of this, $358 billion is for the first $250,000 of all taxpayers' earnings, and the remaining $68 billion is for the tax cuts for income above $250,000 ($200,000 for a single person) that President Obama wants to get rid of. Both Republicans and Democrats want to retain the tax break for 98% of households, but Republicans will try to hold it hostage to the cuts for the other 2%. Since the Bush tax cuts expire if nothing gets done (because they were originally passed through the Senate's reconciliation procedure, which gave them a 10-year lifespan; then renewed for 2 years in 2010), on January 1 the Republicans will have no more leverage on this. Thus, I expect that the middle class tax cuts will be made permanent and, by early January at the latest, the $68 billion will be all that will have expired. Since the wealthy spend less of their income than do the middle class or poor, this tax increase will have little contractionary effect on the economy.

Another set of tax provision affecting couples with over $250,000 and individuals over $200,000 is contained in the Affordable Care Act. These folks will have to pay an extra 0.9% tax on earnings over the thresholds for Medicare, and an extra 3.8% on investment income, starting in 2013. According to an Associated Press estimate, this will raise $318 billion over 10 years, so we'll call it $30 billion for 2013. Since this is part of the funding for Obamacare, the President is highly unlikely to budge on this. Again, as a tax hike on the top 2%, it will have relatively little contractionary effect.

There are $110 billion in automatic spending cuts scheduled in 2013 due to the so-called "sequester." These were triggered last year when no deal was made on long-term deficit reduction. With unemployment still at 7.9%, government spending cuts are definitely harmful to the middle class. To the extent that the $55 billion cut from the defense budget comes from overseas spending, there will be little contractionary effect in this country. That is, if we closed a military base in Germany, it would have more of an effect there than here. In any event, since the United States spends 41% of the world's total military expenditure,* we could afford to redirect quite a bit of this $711 billion annual expenditure (China is a very distant second at $143 billion) to other uses. Nation building at home, as the saying goes.

The other $55 billion would come from domestic discretionary spending, so the middle class would bear the full brunt of this. Of course, neither party wants to see "their" favorite budget items cut, so there is a good chance that these spending cuts will be delayed, which would be a good thing, though not as good as shifting some military spending into the domestic budget.

There's more, of course, but the basic outline is clear: we are seeing a replay of last year's debt ceiling "deal," in which Republicans are trying to pass austerity measures the public does not support and did not vote for in the just concluded election. Indeed, a majority voted not just for a Democratic President and a Democratic Senate, but for a Democratic House of Representatives as well, with Republicans maintaining a majority only due to gerrymandering and compliant Republican courts. As Paul Krugman points out, the self-proclaimed "fiscal hawks" are tying themselves up in knots on why going over the cliff is bad when it achieves their goal of debt reduction. The answer, of course, is that they want to cut "low-priority spending," by which they mean programs benefiting the middle class. As Linda Beale argues, the right course for Democrats is to do nothing until January, when the Bush tax cuts will be gone and we can pass tax cuts more targeted to the middle class as well as redirecting spending from our bloated military to domestic programs.

* Source: SIPRI (Stockholm International Peace Research Institute) Military Expenditure Database 2011, http://milexdata.sipri.org

Cross-posted at Angry Bear.

Tuesday, November 13, 2012

Online International Political Economy Course

If you've enjoyed my posts, you may be interested in my courses, too. In spring 2013, I will be offering an online course at the advanced undergraduate level in my specialization, international political economy (Political Science 3830). This course will examine the main issues of the global economy, including trade, money, investment, and globalization, from a variety of theoretical perspectives and a special focus on who wins and who loses from different policies. I have taught this course for over 20 years and am now in the process of finalizing the online architecture.

This is a regular course at University of Missouri-St. Louis and you may be able to transfer it into your own degree program; needless to say, check with your adviser. To do this, you would enroll as a visiting student.

You can also enroll as a non-degree student if you are simply interested in the subject and are not taking it as part of a degree program.

This is a 3 credit-hour course. Tuition is $265.60 per credit hour for Missouri residents and residents of 22 counties in western and southern Illinois. Out-of-state tuition is $717.90 per hour. You will need to check what other fees may apply (there is a supplement for online courses; beyond that, I am uncertain).

If you are interested, you will need to apply as a visiting student or non-degree student. See here for more details on the admission process. Feel free to contact me at kpthomas55@hotmail.com if you would like more information.

Monday, November 5, 2012

Bain Capital Avoided $102 Million in Taxes Via Dutch Subsidiary UPDATED

A Dutch newspaper, de Volkskrant, reports today (translation here) that Bain Capital used a Dutch subsidiary to avoid $102 million on its taxes. This has been picked up by Taegan Goddard  and the Atlantic Wire. The Dutch author wrote a comment on Goddard’s site clarifying that Bain (not Romney) saved $102 million. From his 2010 and 2011 tax returns, Romney received $2.1 million in dividends and $5.5 million in capital gains. Of course, who knows what he received in previous years, since Romney hasn’t released more tax returns?

Since all the original analysis is in Dutch, which I can't speak, it's hard to say much further at this point, though Bain and the Romney campaign predictably refused to comment. However, the report does show the statement for Bain Capital Fund VIII for the first nine months of 2010 (part of the documents leaked to Gawker, I believe). One illuminating nugget on how private equity makes its money is that the fund reported $174,493,175 in income for the nine months, and a staggering management fee of $46,746,696! This makes it easy to see how private equity folks make so much money whether the underlying investment does well or not.

Of course, this is just one more piece of how the 1% hide their money from taxation. With Romney, it's gotten to the point where we are no longer surprised by this anymore.

Where is the mainstream media on this?

UPDATE: Here is a fuller translation from a Dutch speaker at Daily Kos.

Saturday, November 3, 2012

What Senate Republicans Don't Want You to Find Out

There is a lot of buzz now about the fact, discovered over a month after it happened, that the Congressional Research Service (CRS) had withdrawn one of its research reports due to pressure from Republican Senators. Probably the most commonly used adjectives used to describe the CRS are "respected" and "non-partisan," so what is going on here? The simple answer is that the Republicans didn't like the study's conclusions and complained vociferously to CRS. Why did the CRS give in? No one knows yet, although the New York Times reported:
A person with knowledge of the deliberations, who requested anonymity, said the Sept. 28 decision to withdraw the report was made against the advice of the research service’s economics division, and that Mr. Hungerford [the study's author] stood by its findings.
What was in the report that terrified Republican Senators so much? In fact, a lot more than reported in the media: "Tax Cuts for the Rich Do Not Spur Economic Growth," Talking Points Memo, September 17;  "Tax Cuts for the Rich Cause Income Inequality, Not Economic Growth," Think Progress, September 17; for example.

One major finding is contained in a plot of the top personal income tax rate and real economic growth rates for every year from 1945 to 2010. Contrary to conservative arguments, when the top tax rate was from 70-90+ percent, the country had growth rates averaging 4.2% in the 1950s, but only 1.7% in the 2000s, when the top rate was 35%. Overall, according to Figure 5 of the report, there appears to be no relationship at all between the top tax rate and growth.

It's important to remember, though, that a simple comparison of two variables tells us nothing by itself. It's only when we control for other potential causal factors that we can say whether a relationship does or does not exist between two variables like tax rates and growth. In the report's appendix, the author carries out such a regression analysis, as it's called, and still finds that there is no relationship between the top tax rate and real GDP growth rates.

Moreover, the study takes a look at the ways that lower tax rates are supposed to improve the economy, i.e., by increasing private savings, private investment, and labor productivity growth. In no case does the bivariate analysis (some of which shows higher taxes increasing private savings) or the regression analysis show either the top personal tax rate or the capital gains tax rate having an effect on these intervening drivers of economic growth. This completely undermines the economic arguments for tax cuts as the recipe for a better economy.

But wait, there's more! The diagram (scatterplot) showing the relationship between the top tax rate and the private savings rate shows that the highest private savings rates since 1945 were achieved when the top marginal rate was 70% (see top left of Figure 3), which comports well with recent calculations of the top optimal tax rate (70% or higher). In fact, when the top bracket was 90%, the rate of private savings as a percentage of potential GDP exceeded the rate when it was 40% or below in every year but one!

The other discomfiting finding for the Republican Senators is that lower top tax rates and lower capital gains tax rates increase income inequality. Not only is this obvious in the scatterplots for the top 0.1% and top 0.01%, it remains true in the regression analyses after controlling for other potential causes of the high income shares of the rich.

Tax cuts, then, don't increase economic growth (the ultimate zombie idea, as Paul Krugman says) but do worsen economic inequality. It may even be the case that high top marginal tax rates increase private savings, with the country's historical postwar maximum savings rates coming at a rate of 70%.

What the suppression of this study amounts to, then, is part of the present-day Republican Party's war on science, arithmetic, and knowledge in general. Unable to refute the findings of the CRS report, they demand its censorship instead. As Jared Bernstein says, this is simply scary: "this type of suppression is wholly inconsistent with democracy." That Congress' non-partisan research arm is going along with this makes it especially chilling.

Wednesday, October 31, 2012

Discussing Tax Increment Financing on TV

I recently appeared on a local public access TV show, "Conversation with Lee Presser," discussing tax increment financing and European Union subsidy control regulations. It's a great format, just an almost 30-minute discussion without interruption, which allowed me to explain the problems with TIF as it has been used in Missouri in great detail. We also had a shorter conversation about EU regulations to control investment incentives and other subsidies, which covered the basics of transparency, maximum subsidy rates that vary by how rich the region is, and the reduction in those rates for large projects. Many thanks to Lee Presser for having me on. If you are interested in economic development issues, I think you will enjoy the program.

"A Conversation with Kenneth Thomas - UMSL Professor of Political Science - 10/23/12"

Saturday, October 27, 2012

McMahon's WWE has taken $36.7 million in Connecticut subsidies

U.S. Senate candidate Linda McMahon's World Wrestling Entertainment (WWE) has received $36.7 million in Connecticut film tax credits in 20 separate deals since 2006, reports CTPost.com (thanks to Karin Richmond on the LinkedIn Public Incentives Forum). As in many states, what historically began as tax credits for motion pictures are now available for TV and online media as well, and it is in these two latter categories that the WWE received its subsidies. Also as is typical of other states, the Connecticut program has no job creation requirements, but is calculated simply as a percentage of "qualified expenditures," with the rate being 30% in Connecticut. In fact, in WWE's case, the company had laid off about 60 workers in 2009, yet continued to receive the credits.

Moreover, according to the Sacramento Bee blog, "Cageside Seats," WWE has so little state tax liability that it sells the vast majority of its tax credits via a broker, including 93% of the tax credits it earned in 2007-9. While selling tax credits is perfectly legal (in David Cay Johnston's memorable phrase), it also increases the subsidies that states give, because they wind up giving subsidies to companies that did nothing to qualify for them under any subsidy program.

Nor is WWE alone in its sale of Connecticut tax credits. According to a 2010 article at the CT Post, "of the 80 productions that received credits, only nine applied them to state taxes." The rest, presumably, sold their credits via brokers. The article also states that the national tax credit market had reached $500 million annually in 2010, from $50 million per year in 2005.

Robert Tannenwald of the Center for Budget and Policy Priorities (CBPP) has analyzed state film subsidies and concluded they provide very little bang for the buck. This should not be surprising. Unlike most subsidies, film/TV/digital media subsidies do not go to an investment, but to operating costs. There is nothing left after the crew packs up. Tannenwald points out that even the early adopters of film subsidies (New Mexico and Louisiana), which appeared to have built up some in-state film capacity, are now finding it difficult to maintain their position as the number of states offering such incentives skyrocketed to over 40 by 2010. The increased competition has led states to bid up their reimbursement percentages, to over 40% in Alaska and Michigan. Moreover, it's hard to have job creation requirements for jobs that are inherently temporary.

Tannenwald estimates that the 43 states that gave film tax credits in fiscal 2010 spent $1.5 billion. This is enough to hire back 30,000 state workers laid off since the recession began, at an average of $50,000 per year in salary and benefits.

Although not members of the Forbes 400, Linda and Vince McMahon follow their example in collecting millions in subsidies from government. This is particularly hypocritical since as a Senate candidate McMahon has tried to portray herself as an opponent of "corporate welfare."

Besides having little bang for the buck, film subsidy programs have been rocked by scandal in both Iowa and Louisiana, where the film commissioner was convicted of bribery to accept inflated expense submissions. The Iowa Film Office director was convicted of felonious misconduct, but acquitted on eight other felony charges. A number of credit claimants in Iowa were convicted of felonies as well in other trials.

As I have argued before, investment incentives generally constitute a race to the bottom. However, film and related media subsidies have shown us a high-speed race to the bottom for amazingly little economic benefit. While a few states have cut back on the subsidies due to the recession (and Iowa suspended its program for three years due to the scandal), only federal controls can truly address this problem. My research in Canada (paywalled) found the provinces there similarly unable to control their film subsidy wars. At this point, only transparency in program costs, plus information on the low benefits and frequent scandals, is the only way to generate political pressure for reform.

Sunday, October 21, 2012

Starbucks in Hot Water Over British Tax

Reuters (via Tax Research UK) reported on October 15 the results of an extensive investigation into the British unit of coffee giant Starbucks, the second largest restaurant firm in the world after McDonald's. It turns out that the company has reported losing money in every one of the 14 years it has operated in the country, even as it tells investors that the unit is profitable. Reuters documented this latter fact by getting the transcripts of 46 investor conference calls Starbucks has made over the last 12 years.

For the last three years, Starbucks has paid no income tax at all in the United Kingdom. This is a textbook case of using transfer pricing to hide your profits from the taxman and make them show up in tax havens instead.

According to the Reuters report, there are three potential routes the company has to make its profitable British subsidiary legally have no tax liability.

1) The British subsidiary pays a Dutch subsidiary for the use of trademarks and other intellectual property of Starbucks, at a cost of 6% of sales as royalties. An undisclosed amount of this barely profitable unit's revenue is paid to another Starbucks subsidiary in Switzerland. Where the money goes from there only Starbucks and its accountants, Deloitte, know for sure.

2) Starbucks UK buys its beans through another Swiss subsidiary and they are roasted at a second Dutch subsidiary (this may be a pattern: pay a Dutch subsidiary, which pays a Swiss subsidiary). This gives a second opportunity for transfer pricing, although a transfer pricing investigation by Her Majesty's Revenue and Customs (HMRC) in 2009-10 resulted in no penalties, the company told Reuters (HMRC would not comment). However, Richard Murphy reports that HMRC has been cutting audit staff and been subject to regulatory capture by the companies it is supposed to be regulating.

3) Finally, the British subsidiary's operations are financed entirely through debt, for which it pays interest to other Starbucks subsidiaries. The interest is deductible from income in the UK and can accumulate in tax havens as income there. Reuters found that Starbucks UK pays at least 4 percentage points more in interest than McDonald's UK does.

Paying zero corporate income tax (or corporation tax, as they call it in the UK) gives Starbucks a competitive advantage over other coffee companies that are purely domestic and can't get out of the tax. Not surprisingly, this has ignited a firestorm of controversy in the United Kingdom. In the last 6 days, HMRC officials have been summoned for testimony before Parliament, probably in November. The Irish Congress of Trade Unions (which represents unions in Northern Ireland/UK as well as in the Irish Republic) has called for a boycott of Starbucks. And the company's reputation has been simply hammered in the social media there, with studies by YouGov and Buzz showing sharp dips into negative territory on their measures of brand perception.

Of course, if Starbucks goes to all this effort to avoid British taxes, you've got to wonder what strategies it's using to avoid taxes in the United States. Any reporters out there up for the challenge?

Friday, October 19, 2012

Romney's Accountants Busted in New Tax Justice Network Study

When Mitt Romney released the second of his tax returns last month, he also gave us a summary of his 1990-2009 taxes prepared by his accounting firm, PricewaterhouseCoopers (PwC). The whole point of that exercise, aside from trying to distract people from demanding the actual returns, was to muddy the waters and hide behind the supposedly strong reputation of PwC: an accounting firm would never lie, would it?

Of course, this is a silly question on its face. Who do you think designs abusive tax shelters, other than tax accountants and tax attorneys? Now, in a new study by the Tax Justice Network, we see that there is a positive correlation between a jurisdiction's (remember, not all tax havens are independent countries) secrecy index and the number of banks and Big Four accounting firms (PwC, Ernst & Young, KPMG, and Deloitte) per capita present there. The report documents one "leveraged partnership transaction" that PwC both designed and then pronounced to be legally valid (in what is usually termed an "opinion," for which it was paid $800,000), which the U.S. Tax Court strongly criticized as a "conflict of interest" when it upheld the Internal Revenue Service's squashing of this arrangement.

More specifically, we find that the Cayman Islands had the third most Big Four accounting offices per 1000 population at 0.95, compared with just .001 per 1000 for the United States (see Graphs 4 and 5, p. 24, in the report). This density is almost 100 times higher in the Caymans than in the U.S. The Caymans also had more than twice as many banks per 1000 as any other country, at 4.5 per 1000, compared to .023 per 1000 for the U.S. (Graphs 1 and 2). The graph below shows Big Four offices per 1000:

http://4.bp.blogspot.com/-U6pUUfeRPto/UH6Iz4yqofI/AAAAAAAADHw/kv5pzfBQM5w/s1600/Banks+2.jpg
Source: Tax Research UK

Note, too, that Bermuda (which the Romneys also have used) comes in at about .06 per 1000 population, or about 60 times the U.S. rate.

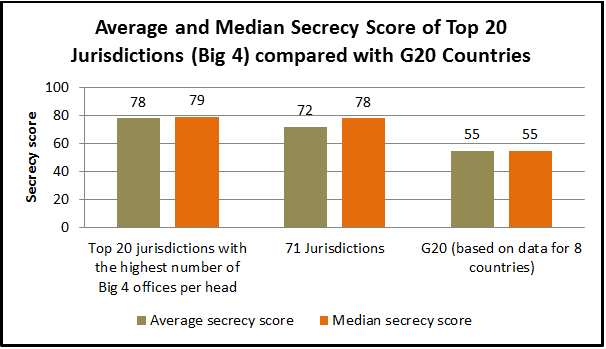
Similarly, we find that comparing the secrecy score of the 20 worst tax havens with the Tax Justice Network's broader list of 71 tax havens and with the G-20 nations shows a much higher mean and median secrecy score in the tax havens than in the non-havens, as the next graph shows.

http://1.bp.blogspot.com/-4_pDLa0lanU/UH6q2h-f6gI/AAAAAAAADIs/BHf1lsgx56U/s1600/16.10-2.png
Source: Tax Research UK

As Richard Murphy, one of the authors of the report, comments at Tax Research UK:
This research lets us conclude that working in conditions of secrecy has become an inherent part of the work of bankers and accountants. It suggests that this has led to a culture of creative non-compliance with laws and regulations, which is likely to increase the potential for, and volume of, crime. At the same time, banks’ and Big 4 firms’ lobbying for laws and regulations that reduce transparency is likely to have resulted in further opacity in the world’s financial system.
This, then, is the world in which Mitt Romney travels, a world in which accounting firms actively seek to create tax avoidance opportunities with little concern for whether they step outside the law's boundaries, and in so doing facilitate the transfer of the tax burden from the 1% to the 99%. In my opinion, PwC's assurances about Romney's tax situation are not worth the paper they're printed on.

Bonus question for President Obama to pose in the third debate: Why is the "McCain precedent" (2 years of tax returns) more important to you than the George Romney precedent (12 years of returns)?

Wednesday, October 17, 2012

Fortune 500 Deferring $433 Billion in Taxes

According to a new report today from Citizens for Tax Justice, the 285 members of the Fortune 500 that have parked money overseas would owe an estimated $433 billion in taxes if and when it is repatriated. No wonder these companies are working so hard to get a "repatriation holiday" even though the one given in 2004 did not yield  any significant new investment, but lots of dividends and stock buybacks.

The new report list 10 companies with $209 billion parked overseas that report the taxes they would owe on these profits (only 47 do so). These companies all report that they would owe 32-35% on their money, which indicates they have not paid any taxes abroad on it; in other words, the money is in tax havens.


Note that some estimates place these figures even higher; in March, I reported that Apple's overseas stash was estimated at $64 billion.

Based on the entire 47 companies that report their estimated tax bill, CTJ came up with an average tax rate of just over 27%. Multiplied by the $1.584 trillion in overseas cash held by the 285 corporations (up from about $1 trillion estimated in March) yields the figure of $433 billion in taxes that would be due if the income were repatriated or the deferral provision for overseas income ended.

What does it all mean? As U.S. companies continue to enjoy record profits, they are declaring them to be foreign profits at a high rate, as we can see in the increase from the March to October estimates. Numerous tech and financial companies have stashed literally tens of billions of dollars, each, in offshore tax havens, which drain billions a year from tax coffers that must be made up with higher taxes on the middle class, larger budget deficits, or cuts in programs. And as we have seen from the two tax returns Mitt Romney has released, there is one tax system for the 1% and another one for the rest of us.


Monday, October 15, 2012

The Folly of Subsidizing Retail

Next to giving subsidies for a company to relocate, or to prevent it from locating, the lease defensible common use of investment incentives is for retail. Why should this be? Let me count the ways.

Most importantly, retail is a derivative economic activity, as David Cay Johnston says. A location's population and income determine how much retail it can support. For this reason, the apparent job creation of retail subsidies is completely phantom, as sales and jobs are simply transferred from older stores to newer locations. The best proof of this is contained in a groundbreaking study by the East-West Gateway Council of Governments, the regional planning agency of the St. Louis metropolitan area.

East-West Gateway's study found that from 1990 to 2007 (i.e., before the financial crisis), the over 100 local governments of the St. Louis metro area had collectively provided over $2 billion in subsidies for malls and other retail facilities. Most of this was in the form of tax increment financing, a popular local subsidy tool in both Missouri (to the tune of $339 million annual average from 2004 to 2006; see p. 7 in the source) and Illinois. Yet, by the end of this 17 year period, there were only 5400 more retail jobs in the metro area than at the beginning. This would total $370,370 per job if the jobs were created by the subsidies; however, it is more likely that they are simply due to income growth in the region. (Note to reporters: This would be a great study to replicate in your area.)

Second, retail jobs are not all that good. Here is a custom graph from FRED showing the nominal wage trend for all production and non-supervisory workers (blue) and for production and nonsupervisory workers in retail (red). As you can see, the wage gap has been increasing for 40 years. As of September, the exact figures were $13.86/hr. for retail vs. $19.81/hr. for all private industries. Moreover, given that the overall total as shown in the graph actually represents a decline in real wages, the decline in retail is much more pronounced.

FRED Graph


In addition to the low pay, retail workers rarely get benefits. According to a new report, only 29% of retail workers get health care benefits, even though half of retail employees have college degrees and 70% are over age 24.

Third, retail does not generate much secondary employment, the way manufacturing does. It does require warehouse jobs, but those generally get subsidized, too, as in the case of Wal-Mart.

The bottom line, then, is simple. Retail is a derivative economic activity that generates almost no new spinoff activity, and local governments (except perhaps in poor areas with food deserts) should not subsidize it. As we have seen in St. Louis, local governments have proven perfectly capable of wasting billions of dollars for temporary gains in sales tax revenues. It's time to stop the madness.

Thursday, October 11, 2012

New Model Legislation Would be Great First Step Toward Subsidy Reform

Yesterday, Good Jobs First released new model legislation to increase the transparency, accountability, and effectiveness of state and local subsidies, which I estimate to total $70 billion per year. If states were to adopt these laws, subsidy administration would improve dramatically, and if all states adopted them, it would put an end to job piracy as well.

The model legislation revolves around four principles.  First, company-specific, web-based reporting of subsidies received and compliance with job quality and other performance requirements. This would be supplemented by reporting by property tax districts of all tax abatements, tax increment financing deals, and other tax reductions affecting school districts and other recipients of property tax revenues.

Second, there would be standards for job creation and job quality (wages, percent full time, benefits, etc.) set that would be specific to the locality. Noteworthy among the provisions is that the model legislation would require at least one new job to be created for every $35,000 in subsidies, and that a company could not count a job towards its job creation commitments if it relocated the job from elsewhere in the United States (not just the state giving the subsidy). This latter provision would prevent states from subsidizing relocations, as happens, for example, at the New York/New Jersey and Missouri/Kansas borders, and even within metropolitan areas like Cincinnati and Cleveland.

Third, states would be required to claw back subsidies if companies did not reach and maintain their job creation and job quality commitments. The legislation gives specific language on how much should be recaptured under various scenarios (a bigger percentage for three years of failure than one year, for example). Moreover, the model legislation provides for private parties to have standing in the courts to enforce the rules if state agencies do not.

Fourth, under the Good Jobs First proposals, states would create Unified Economic Development Budgets, which would track both tax expenditures and on-budget subsidies in every state agency that provided them. This would make it easier for citizens to hold legislators responsible for overall economic development policy, and it would certainly make life easier for researchers like me who currently have to create national estimates based on incomplete data and a relatively small number of states.

These provisions would dramatically improve the transparency and administration of state and local subsidies, but at the same time they show the limits of state-by-state reform. For example, no automobile assembly plant has been built with a subsidy as small as $35,000 per job since the 1980s. No state will commit to that level, because they simply would never receive another auto assembly plant when plenty of states that are good locations for such facilities will give $100-150,000 per job, and at least one (Tennessee) over $200,000 per job. Similarly, I would doubt that many states would commit to stop their job piracy, at least if they were victimized by it to any appreciable extent.

For this reason, I have long argued that federal controls are necessary to rein in these out-of-control subsidies. However, even though governors and economic development officials realize they're in a bad bargaining position, they are not willing to give up their "tools," as we saw when it looked like the courts might rule that state subsidies violate the Commerce Clause (p. 90). For the time being, then, state-level subsidy reform is the only game in town, and the Good Jobs First model legislation is the best cookbook out there.

Thursday, October 4, 2012

Romney Tax Plan as Budget Busting as Ever

Seriously, I could just re-post my February 27th post word for word tonight and it would be just as true as it was then. The Romney tax plan blows a $5 trillion hole in the budget via tax reductions and he still hasn't told us anything about the tax breaks he would get rid of to pay for it, which he has to do because he calls it revenue neutral, as he did again in tonight's debate.

Amazingly, Romney kept denying that his tax reductions reduce revenue by $5 trillion over 10 years when considered by themselves, even accusing the President of lying about it! He kept insisting that his plan was revenue neutral and that he would not adopt a plan that would reduce the share of taxes paid by the rich. Trust him. We have his word on it.* (Apparently, that is how CNN does fact-checking.)

Given his insistence on his proposal's revenue neutrality, let me repeat my 5-step plan, "How to Read a Republican Tax Proposal."

Step 1: Assume revenue neutrality.
Step 2: Look at what income is no longer taxed.

In the Romney plan, according to conservative economist Josh Barro, there is a $1 trillion reduction in corporate income tax, $3 trillion from the 20% reduction in tax rates (again, not 20 percentage points: the top rate falls from 35% to 28%), and $1 trillion from miscellaneous tax reductions, notably abolishing the Alternative Minimum Tax.

Step 3: Determine how much of that income you have.
Step 4: Ask what taxes have to be raised to get to revenue neutrality.
Step 5: Look in the mirror to see who pays them.

That would be the end of the story, except that the Romney budget is also raising military spending by $2 trillion, as the President pointed out in the debate. So that has to be offset, too.

Again, the bottom line is that if we cut taxes for the wealthy and corporations, it will impact the budget elsewhere, in some combination of tax increases on the middle class, program cuts, and deficit increases. Regardless of the spin surrounding it, if a proposal reduces some taxes but doesn't reduce your taxes, you will lose out via these three methods of compensating for the lost revenue.


* If you aren't old enough to remember, this is a reference to a great series of Isuzu car and truck ads featuring "Joe Isuzu," whose signature line was "You have my word on it."

Monday, October 1, 2012

Conservative Refutation of Butler/Heritage Health Care Revisionism Continues

The pile-on continues. As I discussed in February, Stuart Butler of the Heritage Foundation wrote a breath-taking op-ed in USA Today (via Don Taylor) denying that he fathered the individual mandate. In fact, his revised 140-page research paper was published January 2, 1989, before President George HW Bush came into office, let alone President Clinton, whose proposals Butler says his research was directed against. Two conservatives, Avik Roy of Forbes and James Taranto of the Wall Street Journal, played strong roles in locking down the point that Butler was the first to propose the mandate.

Today, J.D. Kleinke of the American Enterprise Institute goes straight to that 1989 report in a New York Times opinion piece to once again lay the mandate at the feet of Heritage. And why not? According to him, the Affordable Care Act is a conservative's dream.
The rationalization and extension of the current market is financed by the other linchpin of the law: the mandate that we all carry health insurance, an idea forged not by liberal social engineers at the Brookings Institution but by conservative economists at the Heritage Foundation. The individual mandate recognizes that millions of Americans who could buy health insurance choose not to, because it requires trading away today’s wants for tomorrow’s needs. The mandate is about personal responsibility — a hallmark of conservative thought.
 Kleinke argues that Romney's incoherence on health care stems precisely from rejecting his accomplishment in Massachusetts. Romney can't offer anything better than the ACA because it is the only conservative way to overcome the problems of the health care market while remaining based on the market and individual responsibility. With no single payer and no public option, it is not surprising that, as he puts it, "the health insurance industry has been quietly supporting the plan all along."

Aside from his odd notion that single payer represents a "government takeover of health care" (Canada's Medicare is not the United Kingdom's National Health Service), Kleinke's column is on the money: historically, the mandate was developed by Heritage economists, the ACA more broadly relies on conservative rather than liberal principles, and many liberals have been unenthusiastic for just that reason. Heck, I'm unenthusiastic (single payer!). But it's a big improvement over the status quo that is already providing benefits to millions of people, whether for young adults, the millions of consumers getting rebates due to the medical loss ratio rule, or for seniors getting rid of the donut hole and gaining free preventive care.

Wednesday, September 26, 2012

Mitt Romney's Unintentionally Hilarious Tax Return FAQ

Unless you've been in a coma, you have certainly heard about Mitt Romney's release of his 2011 tax returns last Friday. You no doubt know that he and his wife did not claim all the charitable tax deductions they were due, so their tax rate would not go below 13% of adjusted gross income. If you read Bloomberg or a newspaper that picked up the Bloomberg story, you know that Rafalca, the Romneys' dressage horse, has disappeared from their 2011 tax deductions. This, of course, raises the question of whether it was a legitimate deduction in 2010 (or earlier?). After all, being in the Olympics probably raised the mare's value, making the profit motive necessary for an allowable business deduction more plausible. So why would Rafalca not be eligible to deduct in 2011 if she were eligible in 2010 and probably gained value?

But have you read the Frequently Asked Questions page the Romney campaign put up about the 2011 returns and the PricewaterhouseCoopers (PwC) summary of the Romneys' 1990-2009 taxes? You should, for the humor value, if nothing else.

In question 9, we learn how PwC calculated the average effective tax rate: they added the tax rate for each year, then divided by 20. This tells us almost nothing, as many observers (here's one, h/t Think Progress) have pointed out: $50 million taxed at 10% (though the campaign claims it was never less than 13.7%) and $5 million taxed at 30% would yield an average tax rate of 20%, using the PwC method, when the true tax rate would be 11.8% ($6.5/$55) in this example.

In the very next question, however, we learn that for the total of federal taxes, state taxes, and charitable contributions (38.49%), PwC used the proper averaging methodology! In other words, adding up all the payment dollars and dividing by the total adjusted gross income (though we don't know what tricks he used before adjusted gross income). Why didn't they do that for tax alone?

In 2011, the Romneys' charitable contributions came to just over twice their federal income tax ($4 million vs. $1.9 million). If that ratio applied for the entire 1990-2009 period, that would make the federal tax portion less than 13% (even lower because I have ignored state taxes). Of course, we have no way of knowing the real rate for federal or state taxes, or charitable deductions, without seeing the actual tax returns.

But wait, there's more! Don't forget all the offshore accounts! To do this question and answer justice, I'll have to quote it in full:

12. There are some investments that seem to be established in offshore accounts, like the Cayman Islands and Bermuda. Are these investments evading taxes?

Note the misdirection in the question, "evading" rather than "avoiding" taxes, which describe illegal and legal maneuvers respectively. Few people think Romney has broken the law, though Nicholas Shaxson considers it to be a possibility.


No, the investments by the blind trusts in funds established in the Cayman Islands or other jurisdictions are taxed in the very same way they would be if the shares were held in the US rather than through a Cayman fund.  No taxes are evaded or reduced.  These funds are all registered with the IRS and report all income to investors and the IRS, just like domestic funds.  Whether in Bermuda or Boston or elsewhere, there is no difference in how they are taxed.

If this were true, why would the funds need to be organized in the Cayman Islands? Boston would be a lot more convenient. No, as Richard Murphy of Tax Research UK told me, these funds are set up to allow round tripping by U.S. investors to avoid U.S. taxes, though some foreigners may also take advantage of them. Moreover, if foreigners are exempt from U.S. taxes like the Unrelated Business Income Tax, what need do they have to invest through the Caymans except to avoid taxes at home? Finally, we know from the Gawker revelations that at least two Cayman funds the Romneys invested in created five blocker corporations, which are set up precisely to allow round-tripping by Americans. How can these funds be established in the Cayman Islands, etc., for any reason other than tax avoidance?

In addition, it is important to note that there are no offshore accounts.  These are investments in funds that are organized outside the US.

A fund organized in a secrecy jurisdiction like the Caymans, Bermuda, or Luxembourg is offshore by definition.

Further, it is important to note that Governor Romney did not make these investments.  Governor and Mrs. Romney's assets are managed on a blind basis.  They do not control the investment of these assets. The assets are under the control and overall management of an independent trustee.

We've known since 1994 what Romney thinks of blind trusts, calling Senator Ted Kennedy's "a ruse."

Finally, the trustee did not choose where the investments were located any more than a stockholder in a Fortune 500 company chooses where that company is organized.  Only the sponsor of the fund decides where it is organized. That responsibility is totally outside the control of a passive investor like Gov. Romney or the trustee of his blind trust.

And a stockholder can sell his shares. Has trustee Brad Malt never heard of "divestment"? I was one of thousands of people active in the late 1970s to get our universities to sell stock in companies doing business in South Africa, the "divestment movement." While we weren't very successful at Princeton, students and faculty at many other universities were, and some major local government funds divested from such firms, too, leading companies like Citicorp to end their South African operations. Malt could sell if he wanted to.


The bottom line is the "same as it ever was," one tax system for the 1% and another one for the rest of us.

Sunday, September 23, 2012

Every State's State/Local Tax System Taxes the Poor More than the Wealthy--And All Exceed Federal Taxes

A new report from the Institute on Taxation and Economic Policy (ITEP) shows that in every state in the country, the bottom 20% of households pay more of their income in state and local taxes than does the top 1%. Washington state was the worst, where the bottom 20% pay a whopping 17.3% of their income in state and local taxes. This was followed by Florida at 13.5% and Illinois at 13.0%. Though the report hints at an exception, a reading of their appendix shows that the only one is the District of Columbia.

As the report points out, such high taxation increases the burden of poverty on the people who, by definition, can least afford it. Moreover, this runs counter to the federal tax system, which in its overall effect (see table below) is progressive. On average, the top 1% pay federal taxes equal to 30% of their income, compared to 1.1% for the lowest 20%.

undefined

Source: Tax Policy Center

Between these two reports, we can see that the bottom 20% of taxpayers pays a much higher portion of their income in state and local taxes than they do in federal taxes. ITEP therefore recommends four major policies to make state and local taxation less regressive.

1) Enact a refundable earned income tax credit for state income tax;
2) Enact property tax circuit-breaker caps for all low-income taxpayers, including renters;
3) Enact other refundable income tax credits for childless households below the poverty level;
4) Enact or increase child tax credits, and make them refundable.

Of course, it should go without needing to be said, but to make federal tax more progressive (think of Mitt Romney and his tax rate below the average 15.1% paid by those in the third income quintile), we should tax capital gains and carried interest the same as ordinary income.

Wednesday, September 19, 2012

More New Books Highlight Plight of Middle Class

The situation of the middle class is a hot topic these days, and rightly so. In addition to James Carville and Stan Greenberg's recent book, It's the Middle Class, Stupid, new books are out by Donald Barlett & James Steele, Jeff Faux, and Mike Lofgren.Together, they advance our understanding of middle class issues significantly.

Barlett and Steele have been sounding the alarm about middle class decline since they wrote the first newspaper articles forming the core of 1992's America: What Went Wrong? In The Betrayal of the American Dream, they tell the stories of everyday Americans, many of whom they kept up with after interviewing them for previous books. They date the beginning of the decline of the middle class to the 1970s, which I think is correct since that is when real wages for production and non-supervisory workers began their forty year decline. They emphasize the central role of Congressional and Presidential decision-making that has given us tax rules favoring the 1%, laws allowing private equity and other corporate raiders to raid pension funds and break contracts with unions and retirees, trade agreements, industry deregulation (which they see as highly destabilizing for the middle class), the destruction of retirement via the assault on pensions and their replacement with 401(k)'s, and the devastation of offshoring.

Their proposed solutions include raising taxes on the rich, and to consider instituting a financial transactions tax (also known as a Tobin tax, after its first proponent) or a gross receipts tax, which would be harder to dodge than the corporate income tax. Barlett and Steele argue further that we need to rebuild manufacturing and reduce the trade deficit, with high tariffs if necessary. They propose massive investments in infrastructure and education, including job training. Finally, they argue that the financial fraudsters who caused the 2008 financial crisis need to be prosecuted. Surprisingly, they say little about getting money out of politics, though they do mention it in their prologue as well as the well-funded corporate propaganda machine.

Jeff Faux, founder of the Economic Policy Institute, was fighting trade agreements long before mainstream economists were willing to admit that maybe free trade isn't always good for everybody, especially workers in the United States. His book, The Servant Economy, is a dystopian vision of the future of the middle class if present trends are not reversed. His basic argument is what he calls an "end-of-empire story," that the U.S. can no longer sustain subsidized capitalism, global military dominance, and middle class prosperity. He argues that the country's former economic and military dominance gave it a "cushion" that was able to sustain the middle class, but that the pressures of international trade and global competition have eroded that cushion along with the nation's ability to achieve all three of the goals mentioned above.

For Faux, much of the problem stems from the increasing U.S. trade deficit, which figures in prominently throughout the book. The rise of finance relative to manufacturing is a key problem as well, one which has made the Democratic Party more dependent on Wall Street Money, which led to Clinton ending Glass-Steagall and Obama treating bankers with kid gloves after he came into office. Worse, as we saw in the 2011 debt negotiations and other instances, the President has made it clear that he thinks there needs to be cuts to Social Security.

"Hope is not a strategy," according to Faux, and he devotes an entire chapter to what he calls "the shaky case for optimism." He foresees a "politics of austerity" that will mean cuts to middle class programs, the continuing loss of good jobs to the trade deficit, and slowly declining living standards and economic security for the vast majority of Americans for decades to come.. He calls cuts to Social Security and Medicare "a done deal." To me, perhaps the single most depressing statistic in the book relates to the much hyped "onshoring" phenomenon: GE has moved some production from China to Louisville, but the workers there make $13/hour compared to the $22/hour they formerly made.

What, then, is to be done? In a talk Faux gave at the Economic Policy Institute August 15th, he explained that he didn't see the need to give a laundry list of policy proposals because, first, he had done so in previous books, and second, there was no point in it unless we change government decision-making. Thus, it is essentially a one-point program, a constitutional amendment that ends corporate "personhood" permanently. This would also have the effect of overturning Citizens United. Without that, he argues, there is no hope.

Lofgren's book, The Party Is Over, is a Republican-eye view of what went wrong, beginning with Newt Gingrich's takeover of the Republican Party. While highly critical of the rightward, anti-science turn of his party, he argues that the Democrats are not much better, and have suffered from extremely bad messaging (he says the stimulus act should have been called the "jobs bill," for example). Interestingly, his major recommendation is to cut trillions from defense spending and redirect it to infrastructure. Of course, he wants to get the money out of politics, too, but cutting defense is his most distinctive policy proposal.

Taken together, these books are largely complementary, though each has its own distinct emphasis. Faux's book, in my opinion, is the best of the three, though also the most depressing. His vision of a likely future is far too plausible to take lightly.

Wednesday, September 12, 2012

UBS Whistleblower's Award Reminds Us Romneys Banked at UBS

Yesterday, the lawyers for Bradley Birkenfeld, the whistleblower in the Union Bank of Switzerland (UBS) tax evasion case, announced that he had received a reward of $104 million from the IRS, its largest-ever whistleblower award. Birkenfeld's ripping away the curtain of Swiss bank secrecy led to $5 billion in extra revenue for the U.S. government, including $780 million from UBS itself, which admitted helping thousands of Americans illegally evade taxes. Not only that, UBS turned over the names of 4500 American clients, and a subsequent amnesty program for Americans with foreign bank accounts in 2009 pulled in another 3000 names (via Matt Yglesias) as of shortly before its deadline. Many more have come in under 2011 and 2012 versions of the amnesty.

The big question behind all this is whether Mitt Romney took advantage of the 2009 amnesty, as Yglesias (link above) suggests. While John McCain saw 23 years of Romney's returns and said there was "nothing disqualifying" in them, he would not have seen Romney's 2009 return. This strengthens the circumstantial case that Romney wants to hide something from that year. So does the fact that Governor Romney declared a Swiss bank account in the one tax return he has released, 2010. Most important of all, the Swiss bank account ($3 million of Ann Romney's blind trust) was at UBS.

Given that the Obama campaign has said that five years of tax returns would be enough, one has to wonder just what could be so awful in his 2005-2009 returns that he still refuses to release them despite all the flak he has gotten over it. I can only think of a short list: tax rate under 13% one or more years, especially 0 federal taxes owed; penalties for under-reporting in prior years; the 2009 amnesty.

Oh, and one more: if his UBS account was one of the 4500 turned over to the IRS by UBS.

Have I missed any?

UPDATE: I see Linda Beale is thinking along the same lines I am.

Sunday, September 9, 2012

Labor Day: U.S. Wages Trail 10 OECD Countries, but with Higher Unemployment than 9 of Them

Contra Eric Cantor, Labor Day celebrates the importance of labor and the labor movement in American history. But the bluster of Cantor, where he celebrates the so-called job creators, does illustrate that organized labor has been in decline in this country for quite some time.

One result of having a weak labor movement is that average wages in the United States have fallen behind those of 10 other industrialized democracies that are members of the Organization for Economic Cooperation and Development (OECD). What is most confounding, for Republicans at least, is that nine of these countries also have lower unemployment, which contradicts their view that high wages (and high minimum wages) harm employment.

The table below below is constructed from data at OECD StatExtracts, showing the average earnings of all wage and salary workers in each country, as well as its most recent unemployment rate (usually July 2012).

Country
2011 Annual Wages
Unemployment Rate Percent


Switzerland
$93,235
4.3
Norway
$81,475
3.1
Australia
$74,512
5.2
Luxembourg
$73,203
5.5
Denmark
$73,032
7.9
Ireland
$66,882
14.9
Netherlands
$57,001
5.3
Belgium
$56,252
7.2
Canada
$56,008
7.3
Sweden
$54,459
7.5
United States
$54,450
8.3
Finland
$53,069
7.6
Austria
$52,404
4.5
Japan
$51,613
4.3
United Kingdom
$50,366
8.0
France
$47,704
10.3
Germany
$46,984
5.5
Italy
$39,112
10.7
Spain
$37,583
25.1
Israel
$35,872
6.5
Slovenia
$30,676
8.1
Korea
$29,053
3.1
Greece
$28,434
23.1
Portugal
$22,559
15.7
Czech Republic
$16,922
6.6
Slovak Republic
$15,513
14.0
Estonia
$14,955
10.1
Hungary
$14,177
10.8
Poland
$13,811
10.0

Source: OECD StatExtracts. For average wages, select data by theme, then labour, then earnings, then average annual wages, and use "2011 USD exchange rates and 2011 constant prices" for each country. For unemployment, select data by theme, then labour, then labour force statistics, then short-term statistics, then short-term labour market statistics, then harmonized unemployment rates.

This table does not make use of purchasing power parity (PPP) conversions to wages (and the U.S. in fact has the highest wages when adjusted for PPP), for a very important reason. Essentially, the PPP calculation adjusts actual exchange rates for differences in the cost of living between countries. In practice, this means downward adjustments for expensive countries like Norway (where I had a personal pan pizza for $25 on my honeymoon six years ago; the New York Times recently published more examples) and upward adjustments for developing countries and even Eastern European countries. As I note in Investment Incentives and the Global Competition for Capital, gross national income per capita for the Czech Republic in 2006 was $12,680 at actual exchange rates, but $21,470 at PPP (page 99).

The reason we should ignore PPP when dealing with wages and jobs is that a company deciding to invest in one place rather than another has to pay the wages using the actual exchange rate and is not affected by PPP. Thus, if there is an effect of wages on employment, that will be a response to what an employer actually has to pay to hire someone, not a hypothetical measure of how well off the worker is in terms of PPP-adjusted dollars. The data here does not show any negative effect of wages on unemployment.

Moreover, I would argue that living in a high-wage, high-cost location has distinct advantages over living in a low-wage, low cost location, even if after adjusting for cost of living (via PPP or within a single country) the lower wage location has "higher" pay. One important reason is that having extra cash gives you extra options. You will have a higher retirement benefit and will keep it if you move to a lower-cost area, whereas the reverse is not possible. You will have better quality services on average, particularly health care. It is far easier for you to vacation in a low-cost location than it will be for someone in a low-cost location to vacation to a high-cost location ($25 personal pan pizzas!). Your high salary will be the benchmark if you take a job in a lower-cost location. If you economize from the standard basket of goods used to measure cost of living, your benefit will be higher in the high-cost area. Of course, a full treatment of this issue requires another post, but the big point is that high wages do not necessarily create unemployment and reducing wages is not the route to middle class prosperity.

Cross-posted with Angry Bear.